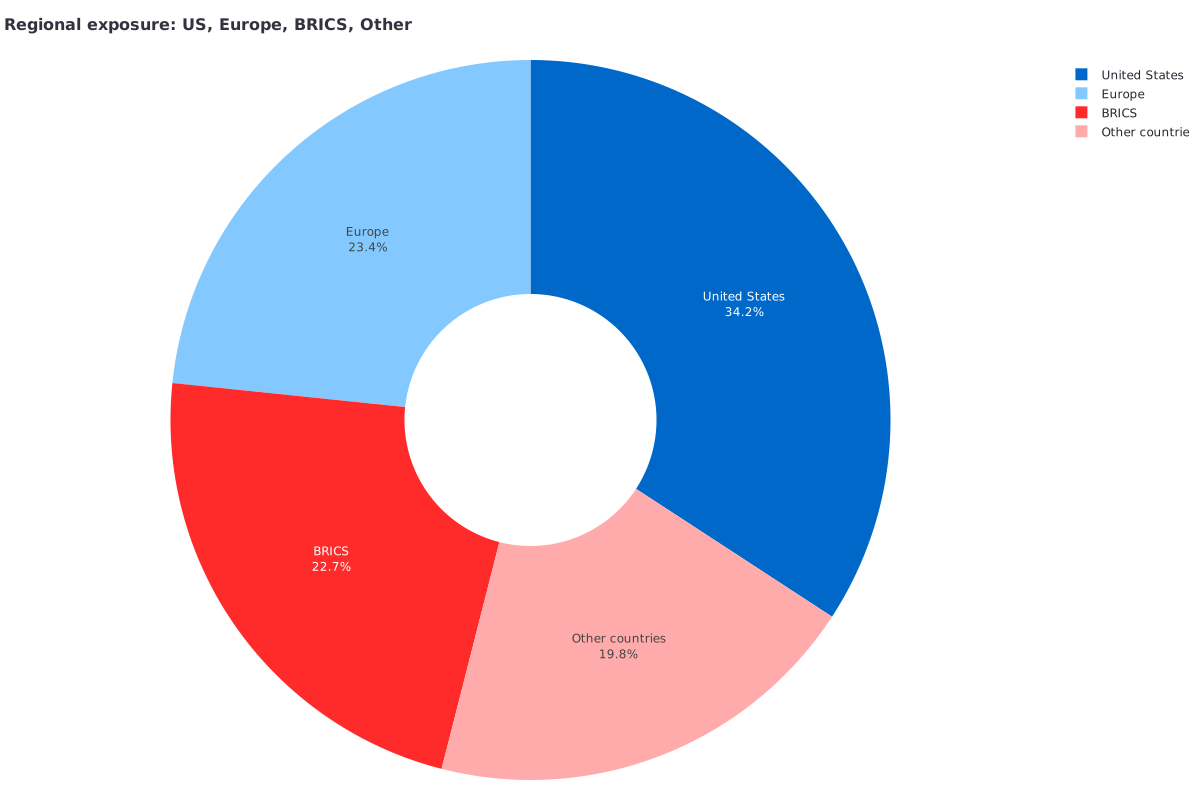
 Figure 1 shows the portfolio TER and the regional distribution of the mapped equity exposure.
Many global ETF portfolios look diversified because they own thousands of companies. In practice, however, a very large part of the money is often invested in the United States. I do not want one country, one currency, or one political system to determine most of my long-term financial result. I respect the strength of US companies, especially in technology, health care, finance, and consumer businesses. Still, I do not believe that such a large part of my portfolio needs to be based in the US.
My objective is not to remove the US completely. It is to build a portfolio that is more balanced across regions and more resilient to political, monetary, and economic changes.
My portfolio allocation
This is the current target allocation:
| Weight | Holding | Role in my portfolio |
|---|
| 40% | UBS Core MSCI World UCITS ETF USD Acc | Developed-market core |
| 15% | Amundi Core STOXX Europe 600 UCITS ETF Acc | Additional European exposure |
| 15% | iShares Core MSCI Emerging Markets IMI UCITS ETF Acc | Broad emerging-market exposure |
| 10% | Invesco Physical Gold ETC | Physical gold allocation |
| 5% | iShares MSCI China UCITS ETF USD Acc | China tilt |
| 5% | Franklin FTSE India UCITS ETF | India tilt |
| 5% | iShares MSCI Brazil UCITS ETF USD Acc | Brazil tilt |
| 5% | iShares MSCI Mexico Capped UCITS ETF Acc | Mexico tilt |
| 100% | Total portfolio | |
The broad MSCI World ETF remains the largest position. I still want exposure to global developed companies, and I do not want the portfolio to depend entirely on my country views. The regional and country ETFs then change the balance without removing the global core. The allocation and weighted TER are calculated directly by my ETF exposure dashboard.
What this allocation produces
Based on the exposure data used in the dashboard, the portfolio has approximately:
| Exposure | Share of the full portfolio |
|---|
| United States | 29.0% |
| Europe | 19.8% |
| China | 7.3% |
| India | 6.1% |
| Brazil | 5.0% |
| Mexico | 4.8% |
| Taiwan | 4.0% |
| Physical gold | 10.0% |
China, India, Brazil, and Mexico together represent approximately 23.2% of the full portfolio.
This is a meaningful difference from simply buying a global developed-market ETF and accepting its market-cap weighting. The US remains my largest individual country exposure, but it is no longer the majority of the portfolio.
The regional donut chart in Figure 1 shows the US at 34.2%, Europe at 23.4%, BRICS at 22.7%, and other countries at 19.8%. These percentages are normalized over the mapped country exposure. Gold and generic unmapped categories are excluded from that calculation. For this reason, the 34.2% shown in the regional chart is not the same as the 29.0% US exposure in the full portfolio.
Why I do not want a US-dominated portfolio
The US has been one of the strongest markets in recent decades. It has excellent companies, deep capital markets, strong universities, and a culture that supports business creation. However, past leadership does not guarantee future leadership.
A portfolio that is heavily concentrated in the US is also exposed to US valuations, US interest rates, the US dollar, US regulation, and US political decisions. Even when the individual companies sell products around the world, their market value can still be strongly influenced by conditions in the US financial system. I am not predicting a US collapse. I am simply accepting that the next 20 or 30 years may not look like the previous 20 or 30 years.
For me, diversification is not only about owning more companies. It is also about owning companies under different governments, currencies, legal systems, economic models, and stages of development.
Why I still keep a 40% global core
Reducing US concentration does not mean that I want to avoid the US. The MSCI World ETF gives me a simple and inexpensive core. It includes many of the most competitive companies in the world and provides exposure to several developed markets. It also reduces the risk that my personal views about individual countries are completely wrong. My regional positions are therefore tilts around a core, not a replacement for the core.
This is important because direct country ETFs carry additional risks. Political decisions, currency movements, regulation, and local market conditions can have a large impact on a single-country fund. The global ETF helps balance those risks.
Why I add direct emerging-market positions
A broad emerging-market ETF is useful, but it does not automatically create the geographic balance that I want.
Market-cap-weighted emerging-market indices can give Taiwan and its semiconductor industry a larger position than I personally prefer. Taiwan has excellent companies and an important role in global technology supply chains, so I do not want to eliminate it. I simply do not want one small geographic area and one industry to define a large part of my emerging-market allocation.
My direct positions in China, India, Brazil, and Mexico allow me to increase the countries that I believe have strong long-term potential. In the full portfolio, Taiwan represents approximately 4.0%. China, India, Brazil, and Mexico together represent approximately 23.2%. This is much closer to the emerging-market balance that I want.
Figure 2 shows the internal composition of my BRICS and emerging-market focus, my European exposure, and the other-country allocation.
The “BRICS / emerging” label in my dashboard is a practical investment grouping. I use it to compare China, India, Brazil, Mexico, and the remaining BRICS exposure. It is not intended as a political classification.
Within this group, China and India are the two largest exposures, followed by Brazil and Mexico. This is intentional.
Why Mexico appears in my BRICS and emerging-market group
The “BRICS / emerging markets” label in my dashboard is a practical investment grouping, not a formal political classification. Mexico is not a BRICS member, and I do not describe it as one. I include Mexico in this part of the portfolio because I see several similarities with China, India, and Brazil. It is a large emerging economy with competitive labor costs, an important industrial base, a growing domestic market, and significant long-term development potential. Since I cannot currently invest in Russia through a liquid and acceptable investment product that fits my portfolio rules, Mexico provides an alternative source of emerging-market and industrial exposure. Mexico also has a very different geopolitical position from the BRICS countries. Its economy is closely connected to the United States through trade, manufacturing, and supply chains. At the same time, it can compete directly with the US for factories, employment, and new industrial investment. It also competes with China and other emerging countries when international companies decide where to move production.
For this reason, I treat Mexico as a separate emerging-market conviction. I place it beside my BRICS positions for portfolio analysis, but I do not consider it part of BRICS.
My case for China
I see China as one of the most important industrial and technological competitors in the world.
China has a very large manufacturing base, extensive supply chains, engineering capacity, infrastructure, and a large internal market. It competes in traditional manufacturing, electric vehicles, batteries, renewable energy, electronics, telecommunications, and other advanced industries. I do not assume that Chinese equities will move in a straight line. The country has clear political, regulatory, demographic, property-market, and geopolitical risks. Relations with the US and Europe can also affect trade and access to technology.
Even with those risks, I do not want a long-term global portfolio with only minimal exposure to China. A direct 5% position, combined with the China exposure already present in the emerging-market ETF, brings the total portfolio exposure to approximately 7.3%. For me, this is large enough to matter but small enough to manage.
My case for India
I see India as one of the most interesting long-term growth markets. The country has a very large workforce, lower labor costs than many developed markets, a growing consumer base, and a strong position in technology and services. It also has the potential to attract more manufacturing as international companies try to diversify their supply chains.
India can benefit from both domestic growth and foreign investment. A large population does not automatically create investment returns, but it can support demand for housing, banking, infrastructure, transport, health care, technology, and consumer products. There are still important risks. Indian equities can be expensive, infrastructure development takes time, and bureaucracy can slow progress. Growth in the economy also does not always translate directly into growth in shareholder returns.
My case for Brazil
Brazil interests me because it combines a large domestic market with agriculture, energy, minerals, water, and other natural resources. It also contains enormous natural capital, including its forests. I do not see forests as a simple financial asset, and I do not assume that environmental importance automatically becomes investment performance. However, access to water, land, food production, energy, and biodiversity can become increasingly strategic over time.
Brazil can benefit from global demand for food, materials, energy, and infrastructure. It also has the potential to grow its internal consumer economy. At the same time, Brazil has a history of political volatility, currency weakness, inflation, and dependence on commodity cycles. Environmental policy and the protection of natural resources are also major long-term questions.
My case for Mexico and nearshoring
Mexico is one of the most interesting parts of this portfolio for me. Its position next to the United States gives it a major logistical advantage. If US and international companies want to bring production closer to the North American market, Mexico can benefit from nearshoring. Manufacturing in Mexico can offer lower labor and production costs, shorter transport routes, and easier access to US customers than production in distant regions. Companies may also want to reduce their dependence on long and politically sensitive supply chains.
I do not expect every US factory to move to Mexico. I do think that even a partial shift in manufacturing, logistics, electronics, automotive production, and industrial supply chains could create opportunities. Mexico is still closely linked to the US economy, so it is not a complete hedge against US weakness. It also has political, currency, security, infrastructure, and regulatory risks.
Europe as imperfect diversification
I often see Europe as closely linked to the US in security, finance, foreign policy, and capital markets. In that sense, I do not view Europe as fully independent from the US economic and geopolitical system. This means European equities are not a perfect hedge against US risk. In a global crisis, the two regions can fall together.
Even so, I believe Europe still adds useful diversification. Europe has different companies, currencies, regulations, political structures, and sector weights. It has important businesses in industrial equipment, luxury goods, health care, pharmaceuticals, banking, insurance, energy, infrastructure, food, and consumer products.
My 15% STOXX Europe 600 position also reduces the dependence on the technology-heavy US market. Together with the European companies already included in the World ETF, Europe represents approximately 19.8% of the full portfolio. The European breakdown is also wider than the eurozone. The largest exposures include the United Kingdom, France, Switzerland, Germany, and the Netherlands. Switzerland and the United Kingdom provide exposure to different currencies and different economic structures. I do not expect Europe to become completely independent from the US. I only need it to behave differently enough to improve the balance of the portfolio.
Why I hold 10% in physical gold
Gold represents 10% of this allocation. I see gold as a long-term store of value rather than a growth investment. It does not produce earnings, dividends, or interest. Its role is different from the role of an equity ETF.
I am skeptical of a monetary system that treats continuous inflation and monetary expansion as normal. My thinking is closer to the Austrian School of economics, with its focus on sound money, savings, and the preservation of purchasing power. Gold gives me an asset that is not directly dependent on the earnings of a company or the promise of a government. It can still be volatile, and it can underperform for long periods, but it has a different risk profile from equities.
I prefer a physically backed gold ETP rather than a synthetic product or a portfolio of gold-mining companies. Gold miners are businesses. Their performance depends on management, labor costs, energy costs, political risk, debt, and the quality of their mines. They are not the same as owning exposure to physical gold. The instrument in this portfolio is an ETC rather than an equity ETF. It does not distribute dividends, so the accumulating versus distributing distinction does not apply in the same way.
Why I avoid a broad commodity allocation
I considered adding other commodities but decided against it. Broad commodity products can increase costs, complexity, and volatility. Some use futures contracts, which introduce contract renewal effects and can perform differently from the spot price of the commodity. I also already have indirect commodity exposure through energy companies, materials companies, industrial businesses, consumer companies, Brazil, and other emerging markets.
This indirect exposure is not identical to owning commodities. A mining company and the metal it produces can behave very differently. Still, I believe the portfolio already has enough sensitivity to energy and materials without adding a separate broad commodity fund. Keeping only gold also helps maintain a competitive total expense ratio.
Country and sector exposure
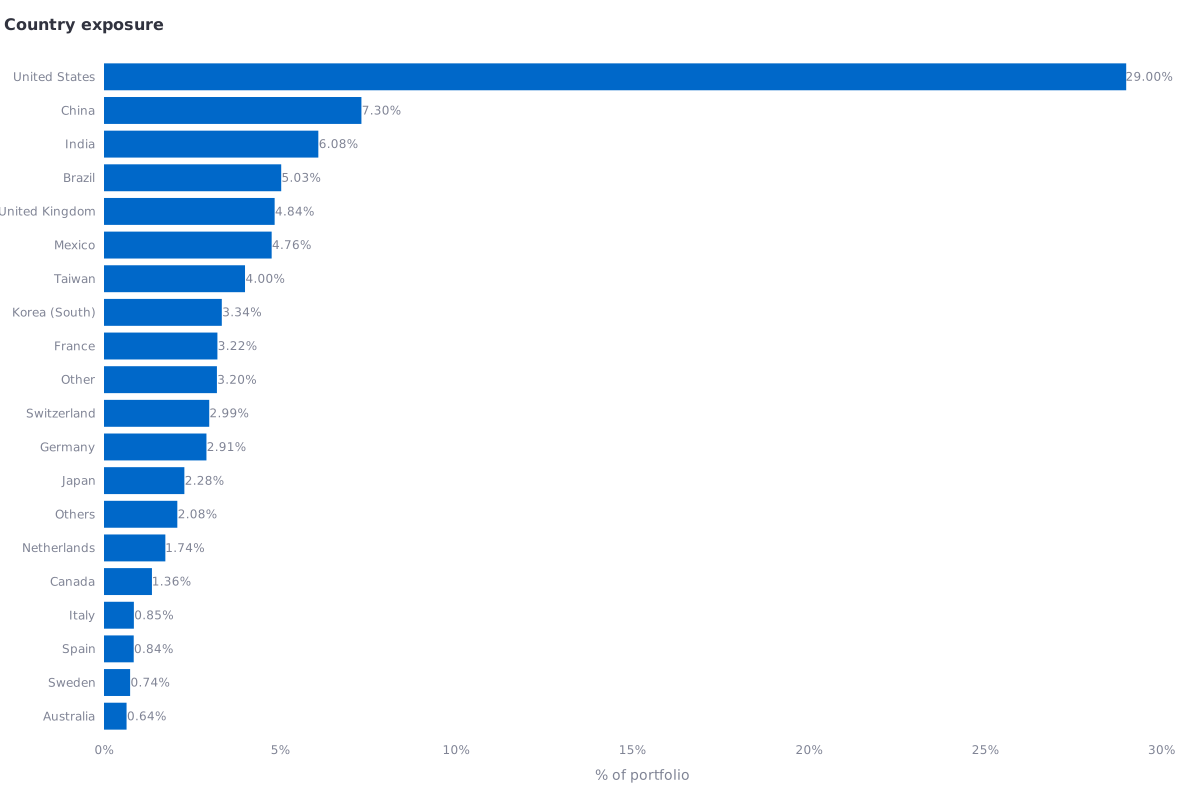 Figure 3 shows that the US remains the largest country exposure, while information technology, financials, industrials, and gold are the largest portfolio categories.
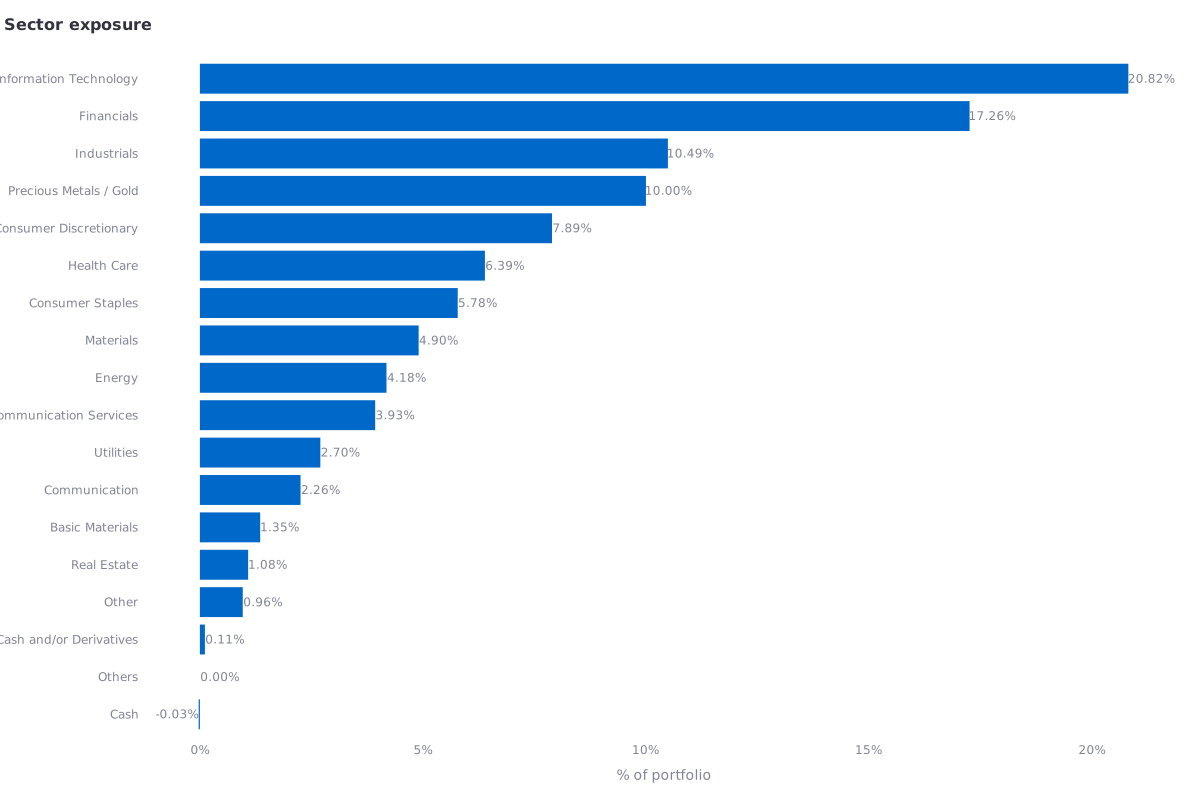 Figure 4 shows the sector exposure.
The portfolio is geographically less concentrated, but it is still an equity portfolio with meaningful exposure to global economic growth. The largest sector allocations are approximately:
| Sector | Approximate portfolio exposure |
|---|
| Information technology | 20.8% |
| Financials | 17.3% |
| Industrials | 10.5% |
| Precious metals and gold | 10.0% |
| Consumer discretionary | 7.9% |
| Health care | 6.4% |
| Consumer staples | 5.8% |
| Materials | 4.9% |
| Energy | 4.2% |
Technology remains the largest sector, but it is much less dominant than it would be in a portfolio concentrated in large US technology companies.
Financials and industrials have important weights because of the additional European and emerging-market exposure. This gives the portfolio more sensitivity to banking, infrastructure, manufacturing, investment, and economic development.
The sector view is approximate because different ETF providers sometimes use different category names. For example, one provider may use “Materials” while another uses “Basic Materials.” I therefore use the sector chart as a directional view rather than a perfectly standardized accounting statement.
A portfolio TER of 0.145%
The weighted total expense ratio of the portfolio is 0.145% per year.
A simple global ETF can be cheaper, but this portfolio includes several targeted single-country ETFs, which usually have higher fees. The small position sizes of those funds allow me to keep the total portfolio cost low. This matters because costs compound in the same way as returns, but in the opposite direction. Every amount paid in fees is capital that can no longer remain invested and grow. A difference of a few tenths of a percentage point may not look important in one year. Over several decades, the effect can become significant. Also, I selected the most liquid ETFs to reduce as much as possible spread.
Accumulating ETFs and tax efficiency
I use accumulating share classes throughout the equity side of the portfolio. Instead of paying dividends into my brokerage account, accumulating ETFs reinvest the income inside the fund. This keeps the money invested and prevents small dividend payments from remaining as idle cash.
For my strategy, this makes compounding more automatic and reduces the need to manually reinvest distributions. It also makes the portfolio simpler to maintain. I consider the accumulating structure useful for tax efficiency in my own setup, but I know that the tax treatment depends on the country of residence. Some countries tax fund income even when it is retained inside an accumulating ETF. I also try to reduce unnecessary selling. Even with low-cost ETFs, frequent trading can create taxes and transaction costs that are much larger than the TER.
The main risks I accept
This portfolio is more geographically diversified, but it is not low risk.
My direct country positions create additional political and regulatory exposure. China can be affected by government intervention and geopolitical tension. India can be affected by high valuations and execution risk. Brazil can be affected by currency and commodity cycles. Mexico remains highly dependent on the US economy.
Emerging-market currencies can weaken against the euro or the dollar. Local stock-market growth may not translate into returns for a foreign investor if the currency falls. Europe may also remain highly correlated with the US, especially during a global financial crisis. Geographic labels do not guarantee independent market behavior. Gold can fall or remain flat for many years. It does not produce cash flow, and its value depends heavily on investor demand, real interest rates, currencies, and confidence in the financial system. I accept these risks because I am not searching for certainty. I am trying to avoid a portfolio in which almost every important risk comes from the same country.
Final thoughts
My objective is not to build an anti-US portfolio. The US remains my largest individual country exposure at approximately 29%. My objective is to avoid making the US the only major driver of my financial future. I keep a 40% global developed-market core, but I add Europe, broad emerging markets, and direct exposure to China, India, Brazil, and Mexico. I also hold 10% in physical gold as a long-term store of value and a form of monetary diversification.
The result is a portfolio with meaningful exposure to several economic systems, currencies, political structures, stages of development, and sources of growth. It still has risks. It will sometimes underperform a simple global or US index. The country positions may be volatile, and international diversification may not help during every crisis.
I accept that trade-off because I value resilience, balance, low costs, and long-term compounding more than following the current market-cap distribution. With a weighted TER of 0.145%, accumulating equity ETFs, limited turnover, and a clear allocation framework, I believe this portfolio gives me a practical way to invest globally without allowing one country to dominate everything.
If you want to experiment with this portfolio and explore how different allocations affect the overall balance, you can adjust the weights and test your own variations using my Streamlit app here!