Equal Risk Contribution MSCI ETF Portfolio: A Quantitative Extension of My Saving Plan
Introduction
In my previous article, Personal Finance: Saving Plan, I explored how a simple, diversified ETF portfolio could form the foundation of a long-term investment strategy. Since then, as part of my Master’s in Finance at the Collegio Carlo Alberto, I’ve decided to take this concept further — to test whether a more quantitatively grounded portfolio could improve stability and risk balance compared to simple equal weighting.
This new study focuses on Equal Risk Contribution (ERC) portfolios — a framework designed to allocate weights so that each asset contributes equally to the overall portfolio risk. It was also a great excuse to dive into C++20, experiment with Monte Carlo simulation, and start building what is now my QuantDream codebase (available on GitHub).
Rationale and Objectives
The primary goal was to construct a better version of my long-term saving portfolio, using data-driven optimization instead of arbitrary weights. I wanted to understand how risk parity behaves when applied to a global ETF universe and how much difference it would make in terms of performance, drawdowns, and robustness.
To keep things consistent, the ETFs were chosen from Yahoo Finance’s historical database for their long data availability and regional diversification. The selection aimed for broad geographic exposure, moderate cost efficiency, and risk balance across developed and emerging markets.
Portfolio Composition
| ETF | Exposure | TER (%) | Weight (%) | Weighted TER (%) |
|---|---|---|---|---|
| Xtrackers MSCI Japan | Japan | 0.12 | 12 | 0.014 |
| iShares MSCI Emerging Markets | China, India, Korea, etc. | 0.18 | 10 | 0.018 |
| Invesco MSCI USA | U.S. market | 0.12 | 28 | 0.034 |
| Gold Commodities ETF | Gold | 0.12 | 27 | 0.032 |
| iShares MSCI Pacific ex-Japan | Australia, Hong Kong, Singapore | 0.20 | 11 | 0.022 |
| Xtrackers MSCI Europe | Europe (UK, France, Germany, etc.) | 0.12 | 12 | 0.014 |
The resulting stationary ERC weights produced a balanced global allocation — about 28% U.S., 27% gold, 12% Japan, 11% Pacific, 10% emerging markets, and 12% Europe — with a total weighted TER of approximately 0.13% per year, confirming that the portfolio remains highly cost-efficient while preserving broad geographic diversification.
Mathematical Foundation
The Equal Risk Contribution (ERC) portfolio seeks to determine the vector of portfolio weights
w = (w_1, w_2, \dots, w_n)such that each asset contributes equally to the total portfolio Expected Shortfall (ES), a coherent risk measure that focuses on the average loss in the worst \alpha% of cases.
The individual risk contribution of asset i is defined using the Euler decomposition of a homogeneous risk measure R(w):
RC_i = w_i , \frac{\partial R(w)}{\partial w_i}.The total portfolio risk is the sum of all contributions:
R(w) = \sum_{i=1}^{n} RC_i.Here, the risk measure R(w) corresponds to the Expected Shortfall at confidence level \alpha:
ES_\alpha(w) = \mathbb{E}\big[L_p ,\big|, L_p \geq \text{VaR}_\alpha(w)\big],where L_p = -w^\top r is the portfolio loss and \text{VaR}_\alpha(w) is the Value-at-Risk at confidence level \alpha
Because ES has no analytical closed form unless one assumes normality (an assumption rejected by empirical evidence), the gradient \frac{\partial R(w)}{\partial w_i} must be estimated numerically.
In this implementation, ES and its marginal components were obtained by Monte Carlo simulation over thousands of synthetic return paths generated via block bootstrap resampling, which preserves both autocorrelation and volatility clustering.
For each simulated path, the portfolio losses were computed, sorted, and averaged over the worst \alpha% tail to approximate ES_\alpha(w), while marginal effects on each asset were estimated by finite differences.
The equal-risk condition thus becomes:
RC_1 = RC_2 = \dots = RC_n = \text{constant.}and the optimization objective is to minimize the dispersion of the marginal ES contributions around their mean \overline{RC}:
\min_{w} ; L(w) = \sum_{i=1}^{n} (RC_i – \overline{RC})^2subject to non-negativity and full-investment constraints:
w_i \ge 0, \qquad \sum_{i=1}^{n} w_i = 1.This is solved iteratively using a multiplicative update scheme:
w_i^{(t+1)} = w_i^{(t)} \times \frac{\overline{RC}}{RC_i + \varepsilon},with damping to improve convergence stability:
w_i^{(t+1)} \leftarrow (1 – \lambda), w_i^{(t)} + \lambda, w_i^{(t+1)}, \qquad 0 < \lambda \le 1.By replacing the volatility-based measure with a Monte Carlo–estimated Expected Shortfall, this ERC formulation captures non-Gaussian tails, asymmetric risk, and serial dependence in returns — providing a far more realistic and robust allocation for real-world financial data.oach replaces static covariance estimation with empirically simulated scenarios, resulting in a more robust and realistic evaluation of ERC portfolios under uncertainty.
Monte Carlo Simulation Engine
The core engine (written in modern C++20 with Eigen) supports several simulation methods:
- Vanilla Bootstrap: resamples contiguous return blocks to preserve serial correlation.
- Lambda-Bias Sampling: biases the resampling toward drawdown periods using a loss penalty λ.
- Stationary Bootstrap: draws random block lengths from a geometric distribution, with exponential tilt θ toward adverse states.
For a given time series of returns rₜ, the stationary method defines selection probability:
P(t) \propto \exp\big(\theta \times \max(0,,-r_t \cdot w)\big)and draws block lengths L ~ Geometric(p) with expected mean equal to the desired block size.
Progressive ERC Optimization
To ensure robustness, the ERC optimization was repeated over increasing data fractions (25%, 50%, 75%, 100%), each averaged across parallel Monte Carlo threads using std::async.
For every method (Vanilla, LambdaBias, Stationary), I computed weight stability and convergence.
The final selection was based on the median stationary case, as it produced the most stable and interpretable weights — balancing diversification and low sensitivity to outliers.
Why stationary? Because it preserves serial dependence while still exploring long-term distribution tails, unlike pure bootstrap methods that often underestimate persistence in financial time series.
Experimental Setup
- Simulations: 1,000 per method × 4 data fractions
- Samples per simulation: 365 days
- Block size: 7 (approx. one trading week)
- α (tail level): 5%
- Optimization: 50 iterations of multiplicative updates
- Convergence: relative deviation tolerance 10⁻³
- Parallelism: up to 21 threads
- The optimization was driven by the condition: RC_i \approx \frac{ES_p}{N}
where ES_p is the portfolio expected shortfall, computed from simulated losses.
Results: Weight Stability
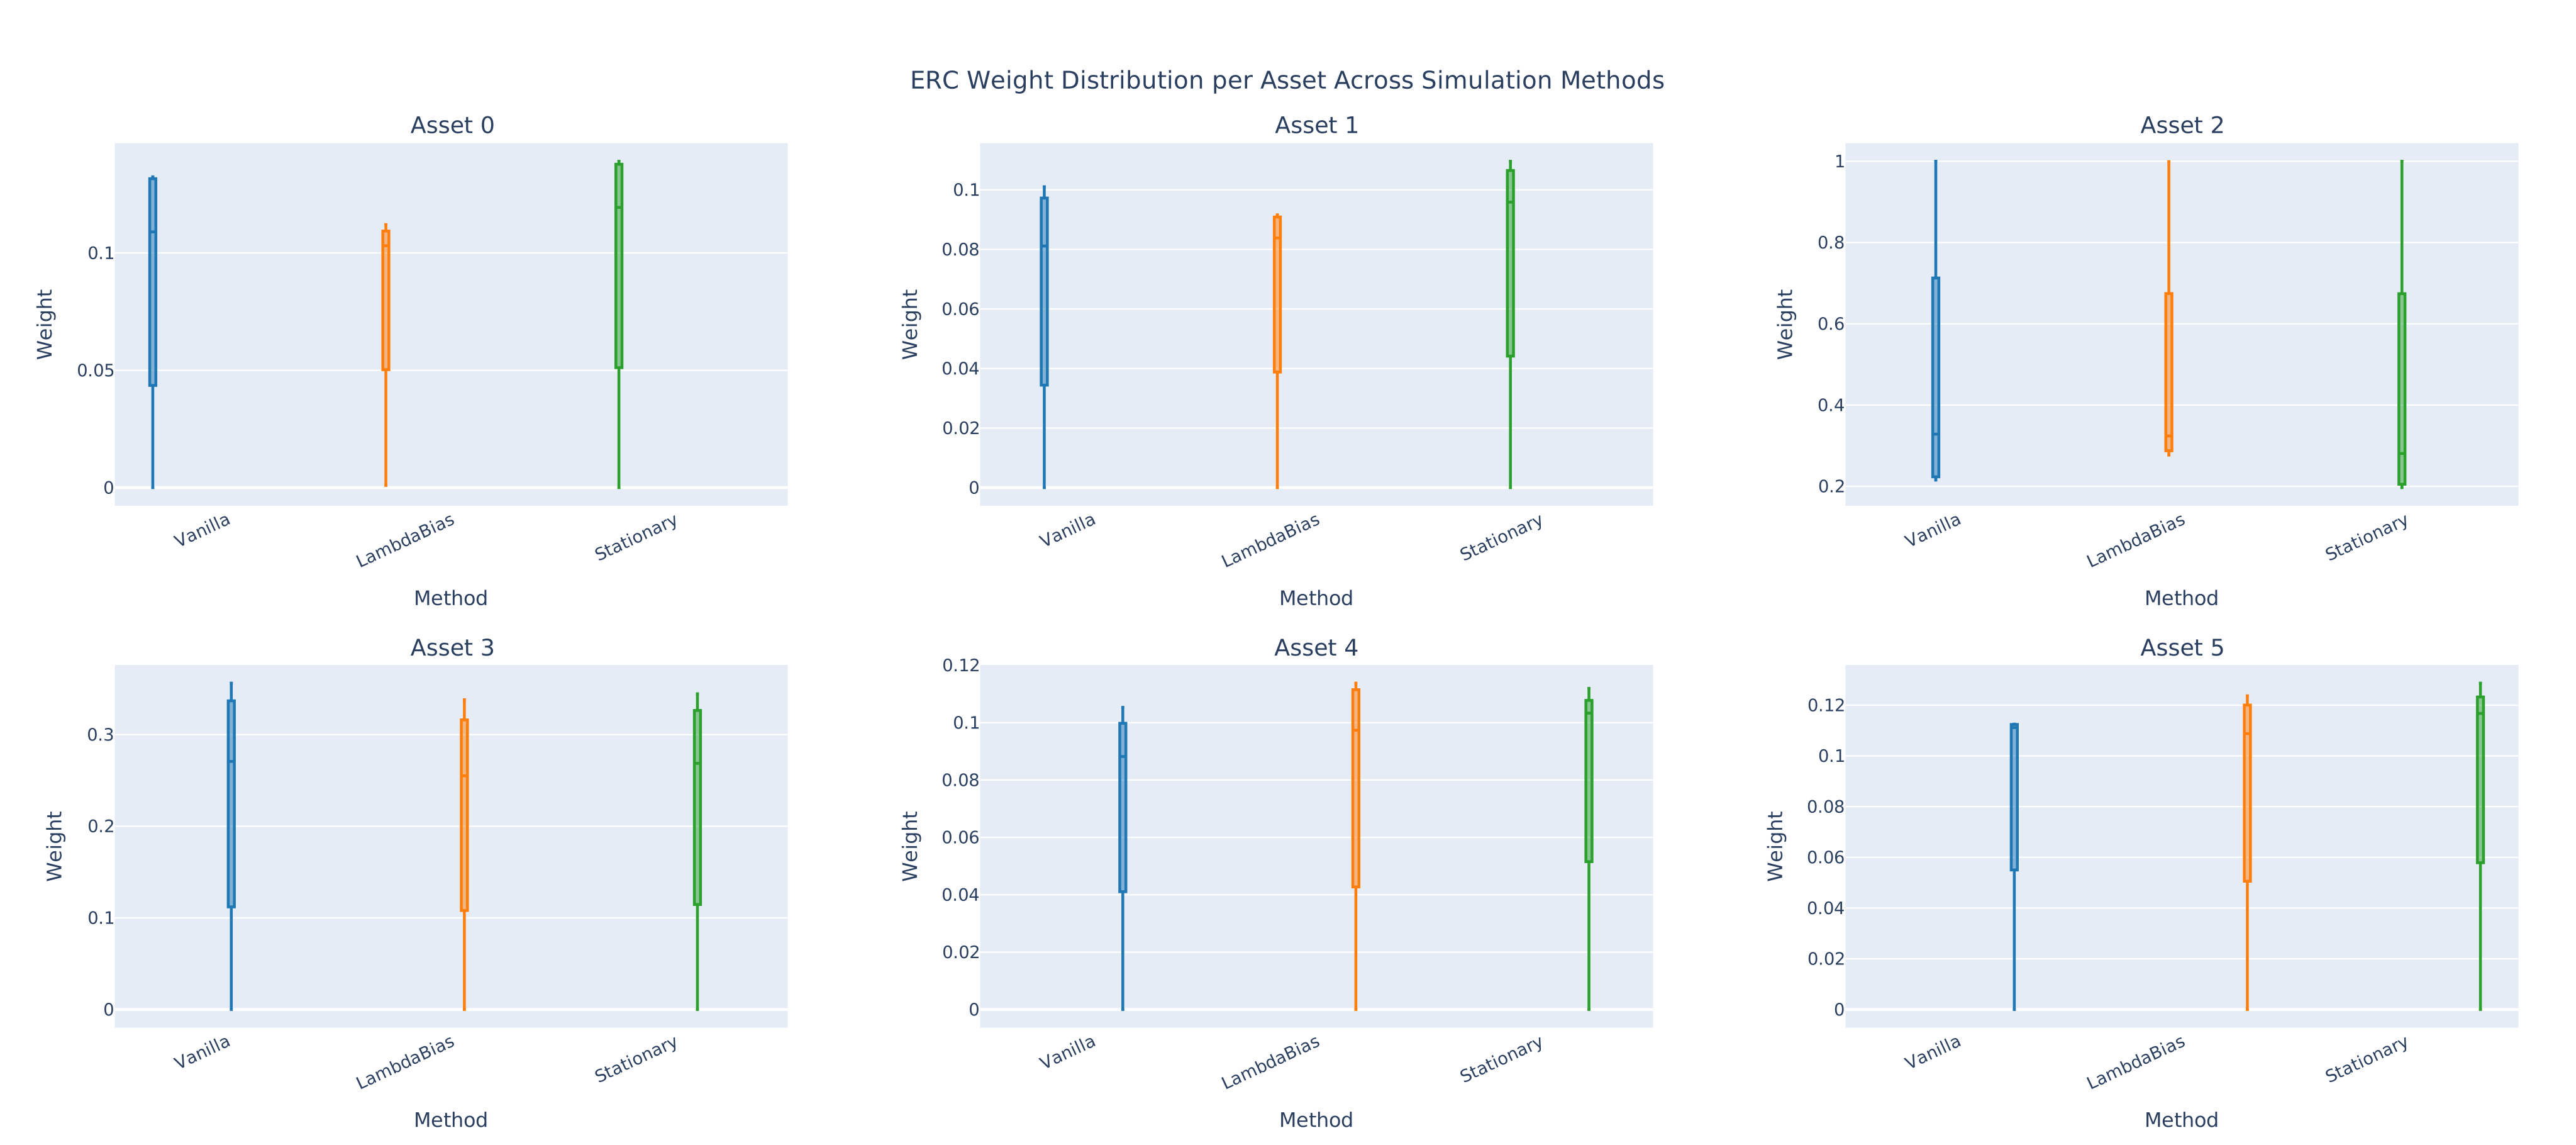
Across fractions, convergence improved steadily, and by the 100% dataset, all three methods converged to coherent weights. The stationary approach showed the smallest variance across threads and a more balanced exposure across assets (see ERC weight distribution plot).
Interestingly, the ERC allocation leaned slightly more toward gold and the U.S. ETF, consistent with their low cross-correlation with other assets.
Equal vs. ERC Portfolio Comparison
Once the ERC (Equal Risk Contribution) weights were derived, I ran 10,000 additional Monte Carlo simulations to evaluate their performance against a naïve equal-weight benchmark. Each simulation produced five years of daily synthetic returns using the same block-bootstrap resampling engine, which preserves temporal dependence and volatility clustering—a more realistic alternative to random shuffling.
The evaluation included both simple and compounded cumulative returns, computed for the full ensemble of paths and for the worst 5% tail subset, representing stressed market scenarios.
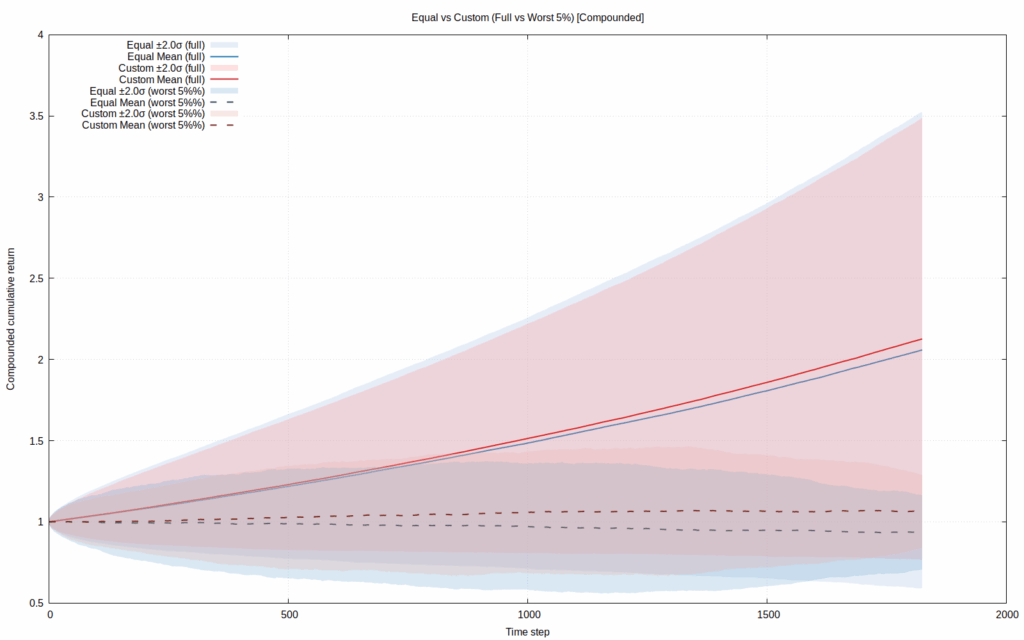
The first figure shows the evolution of compounded cumulative returns under both portfolio schemes.
The solid lines represent mean cumulative performance, while the shaded bands depict the ±2σ confidence regions of the simulated paths.
- Red lines/bands: ERC-weighted portfolio
- Blue lines/bands: Equal-weight portfolio
- Dashed lines: Mean and dispersion for the worst 5% tail scenarios
As seen, both strategies exhibit steady growth over time, but the ERC configuration maintains consistently higher compounded growth with narrower dispersion.
The upper tail of the ERC band reaches slightly higher cumulative returns, while the lower tail remains tighter—indicating improved risk efficiency.
Even under severe stress (dashed bands), the ERC model exhibits shallower drawdowns and faster recovery.
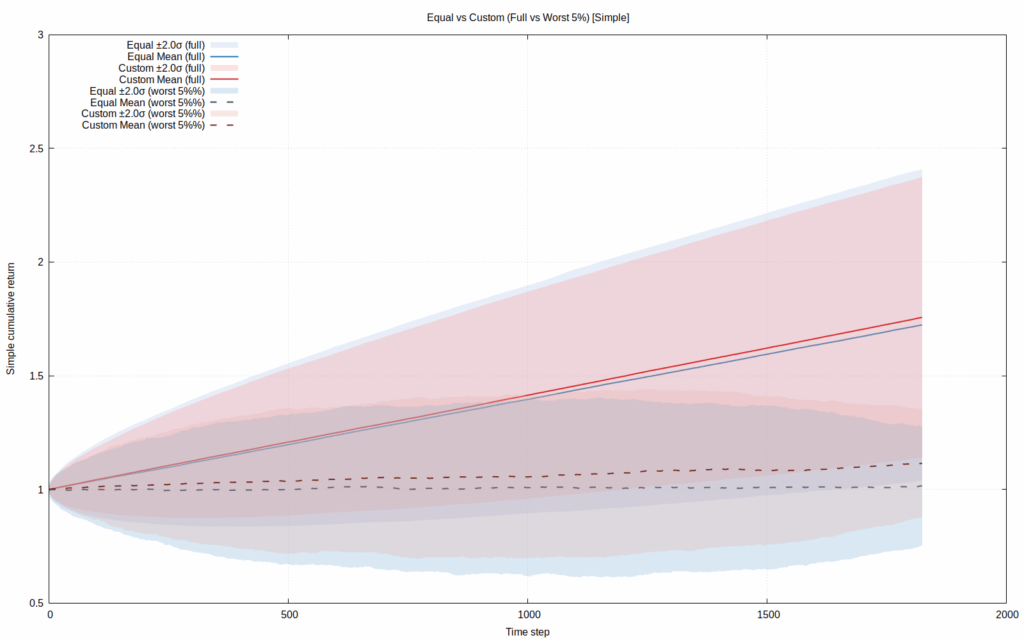
The second figure displays non-compounded (additive) cumulative returns over the same simulations.
This representation emphasizes linear accumulation of daily returns without reinvestment effects, allowing a clearer view of volatility propagation.
Once again, the ERC portfolio (red) demonstrates superior mean performance and smaller downside spread compared to the equal-weight baseline.
The difference between the two strategies becomes more evident in the lower tail, confirming that ERC mitigates the concentration of risk during adverse market phases.
| Metric | Equal Weight | ERC (Custom) |
|---|---|---|
| CAGR (annualized) | 10.48% | 10.98% |
| Annualized Volatility | 8.27% | 7.37% |
| Annualized Sharpe Ratio | 0.61 | 0.72 |
| VaR (5%) | −1.22% | −1.11% |
| ES (5%) | −1.96% | −1.75% |
Overall, the ERC approach demonstrates slightly higher returns, lower volatility, and better tail protection.
By equalizing marginal contributions to portfolio risk rather than raw weights, the ERC method improves risk-adjusted efficiency without overconcentrating exposure to any region or asset class.
Even though the improvement in CAGR may appear modest, its effect compounds significantly over time—especially given the superior downside control observed in the worst 5% of Monte Carlo paths.
In essence, while both portfolios perform well under average conditions, the ERC configuration shows greater resilience in adverse scenarios and smoother compounding trajectories, aligning with its theoretical objective of balanced risk allocation.
Robust Statistical Measures
Traditional mean and variance can be distorted by extreme returns. To test robustness, I applied two robust location estimators from the QuantDream statistical module:
- Trimmed Mean: excludes the top and bottom α% of returns.
- Winsorized Mean: caps the tails at α% instead of removing them.
These led to robust Sharpe ratios that were consistently higher:
| Portfolio | Trimmed Sharpe | Winsorized Sharpe |
|---|---|---|
| Equal-Weighted | 0.88 | 0.73 |
| ERC (Custom) | 1.01 | 0.87 |
This indicates that the ERC configuration not only had better mean performance but was less sensitive to outliers and tail losses.
Geographic and Cost Analysis
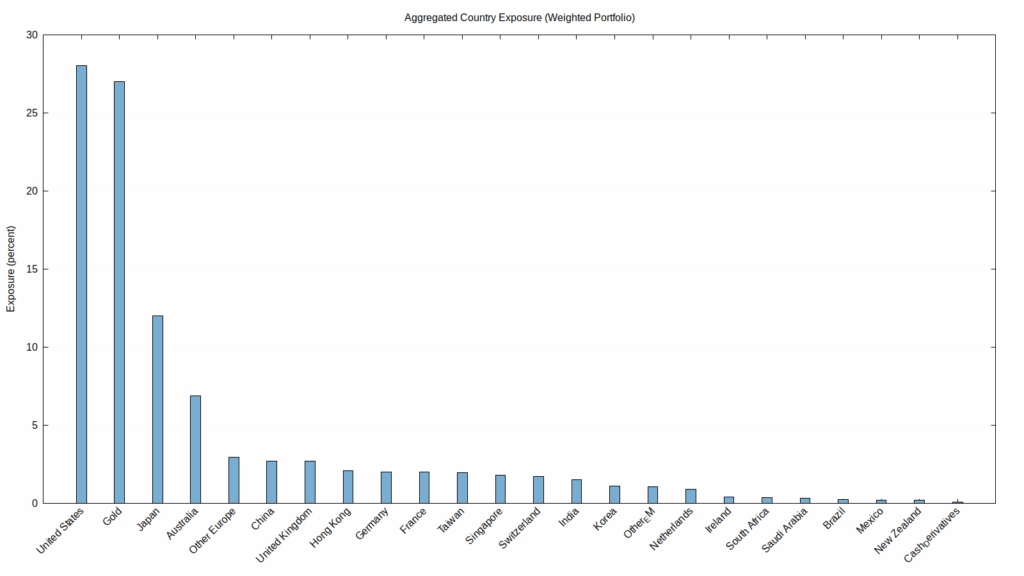
The final ERC allocation produced a globally diversified structure with balanced exposure between developed markets, commodities, and emerging regions.
As shown in Figure 1, the portfolio remains well-spread:
- United States (28%) and Gold (27%) form the two largest pillars — the former capturing long-term equity growth, the latter serving as a monetary hedge and volatility dampener.
- Japan (12%) and Australia (6.9%) add exposure to the Asia-Pacific region, which complements the U.S.-centric component while reducing overall correlation.
- Emerging markets (≈10%) and Europe (12%) complete the allocation, ensuring that no single macroeconomic block dominates portfolio risk.
This configuration effectively blends growth-oriented developed equities with diversification assets that can perform in different market regimes.
The inclusion of gold and Pacific exposure, in particular, acts as a stabilizer during U.S. or European downturns, reducing cyclic concentration.
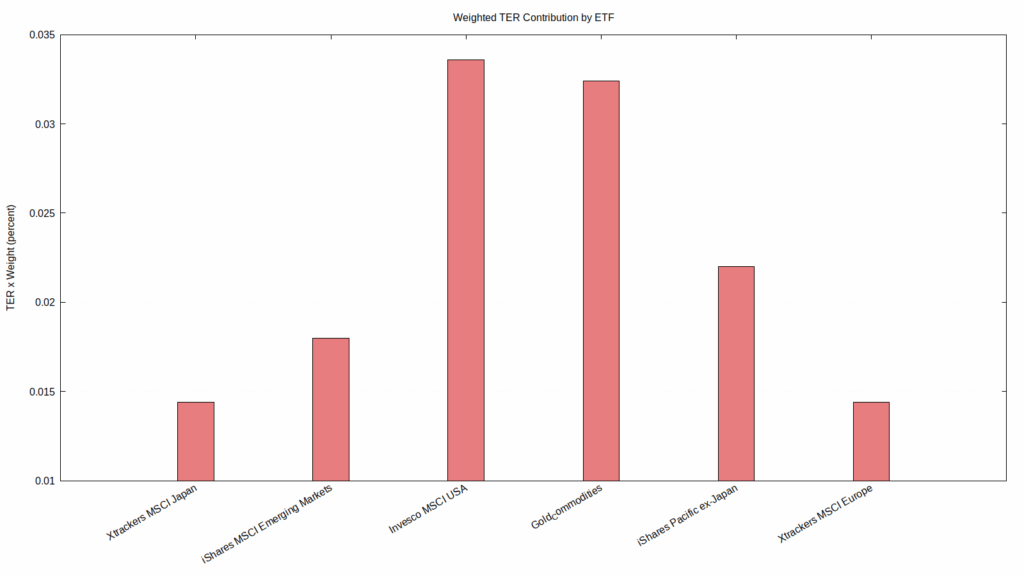
This figure reports the weighted Total Expense Ratio (TER) for each ETF, computed as
\text{Weighted TER}_i = w_i \times \text{TER}_i.Even after accounting for the higher fees of certain regional ETFs (such as Pacific ex-Japan and Emerging Markets), the total weighted TER remains below 0.15% per year, an exceptionally low level for a globally diversified multi-asset portfolio.
The Invesco MSCI USA (0.034%) and Gold ETF (0.032%) account for the largest proportional cost, reflecting their higher weightings rather than inefficient fund selection. Meanwhile, low-cost instruments such as Xtrackers MSCI Japan and Xtrackers MSCI Europe keep aggregate expenses contained.
This balance confirms that the portfolio’s risk efficiency does not come at the expense of cost efficiency, an important principle when designing a long-term, compounding-oriented investment plan.
Overall, the resulting ERC allocation combines:
- Broad geographic exposure, minimizing idiosyncratic regional shocks.
- Structural hedges (gold, Pacific) that support resilience.
- Ultra-low cost base, preserving compounding effects over time.
This makes the portfolio not only robust in risk terms but also sustainable from a long-term fee perspective, aligning well with the philosophy of efficient, evidence-based investing.
Discussion
The final ERC allocation was derived through an extensive Monte Carlo optimization process, involving 21 independent batches of 10,000 simulations each.
Each batch generated synthetic return paths via block bootstrap resampling, ensuring temporal dependence and realistic volatility persistence.
This iterative setup allowed the ERC solver to converge toward a stationary median weight configuration, balancing robustness and computational feasibility.
While these results already exhibit stable and consistent convergence patterns, there is still room for refinement.
More sophisticated approaches, such as copula-based resampling, Bayesian shrinkage of covariance matrices, or stochastic dominance constraints, could further enhance precision, especially when modeling fat-tailed, asymmetric return distributions.
Nevertheless, the current framework provides a solid, risk-driven foundation built on empirical simulation rather than arbitrary parameter tuning.
Arbitrary design choices were inevitably made, such as the number of bootstrap blocks, the choice of α for tail selection, or the convergence threshold for the multiplicative updates, but each was supported by a clear quantitative and rational basis.
The portfolio remains driven by risk allocation principles, not subjective market forecasts, aligning with the ERC philosophy that capital should be deployed in proportion to risk, not to expected return alone.
Compounded Growth and Investment Horizon
Since nearly all selected ETFs are accumulating (distributing no dividends), with gold being the only partial exception as it tracks spot prices, the most appropriate measure of long-term performance is compounded cumulative return.
From the Monte Carlo distribution of outcomes (as illustrated in the compounded-return plot), we can infer that with 95% probability, the average compounded return even within the worst 5% of simulated scenarios still exceeds the initial investment after the full horizon.
This implies that the portfolio exhibits a positive expected growth trajectory with capital preservation at the 5% lower bound.
Based on these dynamics, a minimum recommended investment horizon of five years appears reasonable: shorter horizons may not fully capture the compounding advantage nor the mean reversion of risk premia following drawdowns.
Efficiency and Risk Distribution
The simulation experiments confirm that risk-based allocation, even when applied to a modest retail portfolio, can yield meaningful efficiency improvements.
The ERC structure reduces volatility clustering and stabilizes tail behavior, producing smoother cumulative growth compared to naïve equal weighting.
Crucially, the goal of ERC is not to maximize return, but to systematically distribute risk across all holdings, ensuring that no single volatile asset (e.g., gold or emerging markets) dominates the overall portfolio behavior.
This risk-parity discipline enhances drawdown resilience and fosters long-term stability under non-Gaussian return dynamics, where traditional mean–variance optimization may fail.
Conclusion
This project represents a clear shift — from a static, intuition-based investing mindset to a quantitative, simulation-driven discipline grounded in data, risk theory, and reproducible computation.
By combining robust statistics, Monte Carlo methods, and modern C++ quantitative tooling, I’ve developed a flexible experimental framework that goes beyond mean–variance optimization, a framework highly sensitive to estimation errors in the mean vector and covariance matrix, making it unreliable in empirical applications. It provides a foundation for exploring a broad spectrum of advanced portfolio methods: Expected Shortfall (ES) optimization, risk-parity extensions, and even robust Bayesian estimators for uncertainty-aware allocation.
The resulting ERC MSCI ETF Portfolio demonstrates that even a retail-scale portfolio can meaningfully benefit from quantitative rigor:
- Balanced exposure across geographies and asset classes, reducing concentration risk.
- Lower volatility and higher Sharpe ratios, confirming greater efficiency per unit of risk.
- Improved resilience under tail conditions, as validated through 210,000 Monte Carlo simulations.
- Ultra-low total expense ratio (<0.15%), ensuring that performance gains are not eroded by costs.
Importantly, this process was not about chasing higher returns but about structuring risk intelligently.
By equalizing marginal contributions to Expected Shortfall rather than variance, the ERC framework acknowledges that financial returns are not Gaussian — they are skewed, clustered, and heavy-tailed.
Even under these realistic conditions, the model achieved stable compounding, with 95% of outcomes preserving or growing capital after the five-year horizon — a rare feat for an unleveraged, globally diversified ETF basket.
Looking forward, this foundation will evolve into a template-driven QuantDream library, supporting:
- Mean–CVaR optimization under empirical distributions,
- Hierarchical risk clustering and dynamic factor tilting,
- Real-time backtesting and Monte Carlo stress simulation.
Leave a Reply